Appearance
Dashboard
The Construction Dashboard shows, on one page, how all your projects are doing: their progress, money (contract value, certified, cost, margin), what needs doing today, risks, quality and safety. Managers use it every morning; anybody can use it to jump to the records that need action.
WHERE AND WHO
Open . Every construction user can open it. The figures follow your rights: a project manager sees only the projects they can access; a Construction Director sees all the projects of the company. All amounts are shown in the currency of the current company.
The filters at the top
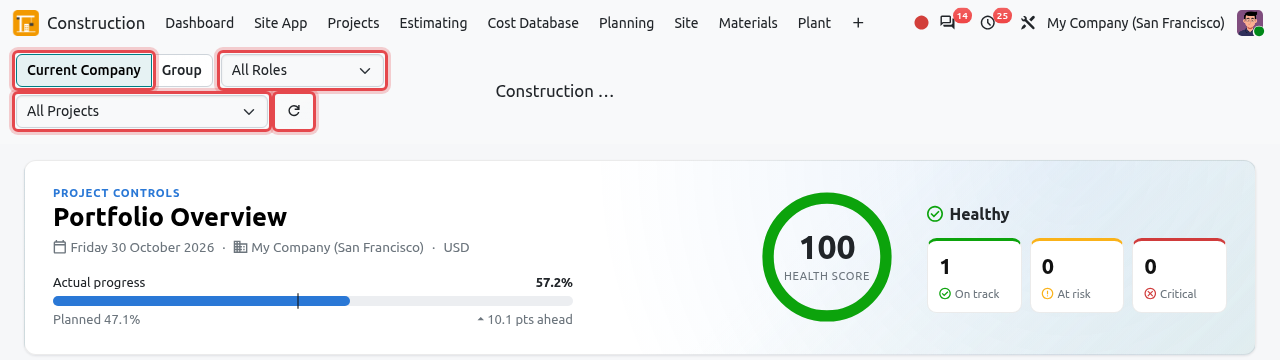
- Current Company / Group: shown only when several companies are selected in the company switcher (top right). See Company and group view.
- All Roles: show only the projects where our role is Main Contractor, Subcontractor, Developer / Owner or PMC / Consultant (see Our role).
- All Projects: choose one project to see the whole dashboard for that project only.
- The round arrow ↻ reloads the figures.
Portfolio Overview
The first block summarises the whole portfolio (all projects shown):
- Actual progress against Planned progress, weighted by the budget of each project. The text "x pts ahead" or "behind" gives the difference.
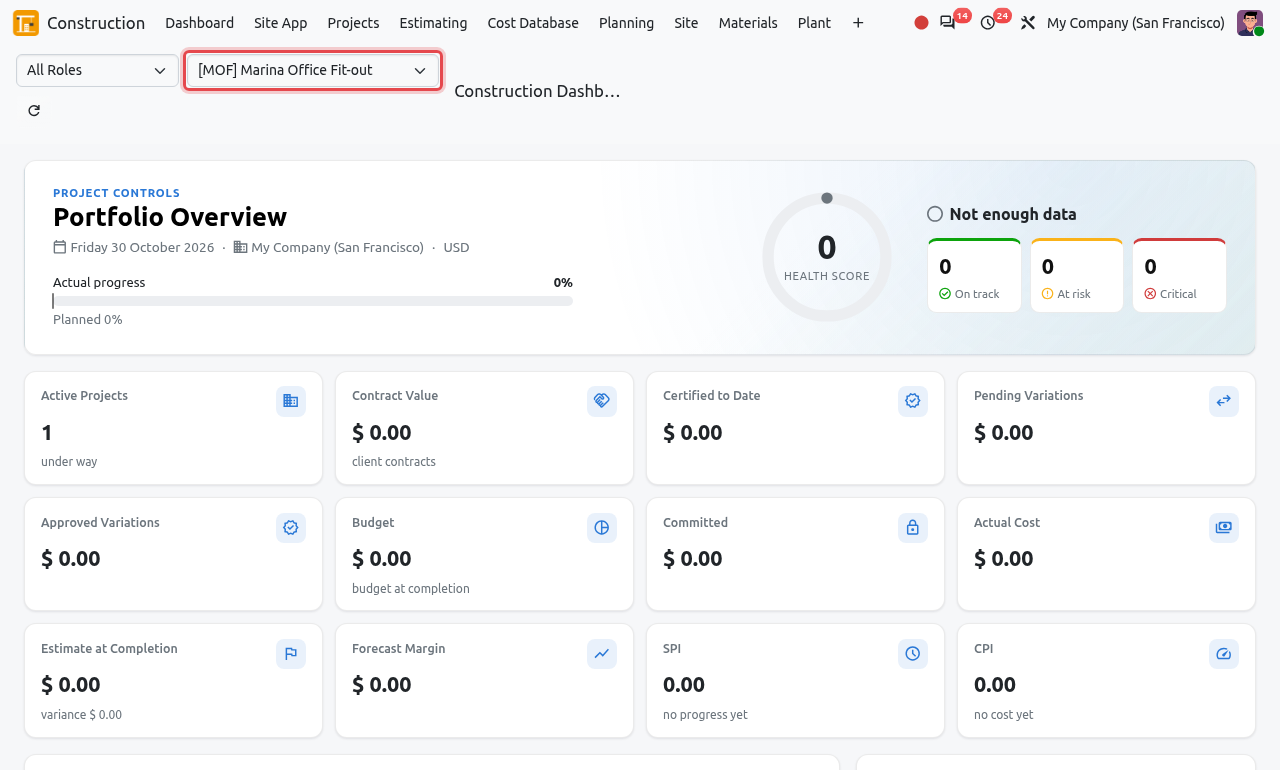
- The Health Score (0 to 100) combines the schedule index (SPI), the cost index (CPI) and the health of each project. 85 or more is Healthy (green), 65 to 84 Needs attention (orange), below 65 At risk (red). When no project has progress or cost yet, it shows Not enough data.
- The three boxes count the projects On track, At risk and Critical (see project health).
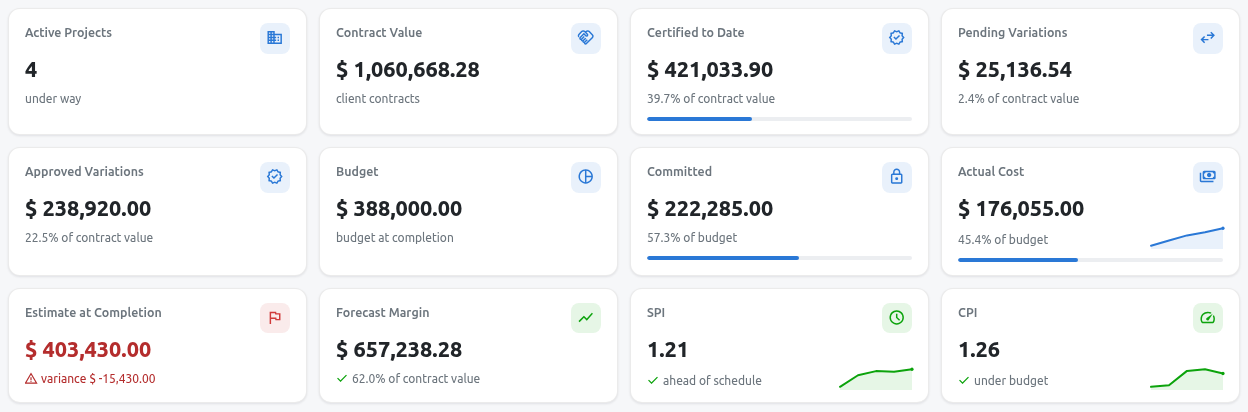
Key figures
| Tile | What it means |
|---|---|
| Active Projects | Number of construction projects shown. |
| Contract Value | Total value of the running and closed client contracts (see Contracts). |
| Certified to Date | Work certified to the clients so far, and its share of the contract value (see Payment Certificates). |
| Pending Variations | Value of the client variations submitted but not yet decided by the client. |
| Approved Variations | Value of the client variations already approved. |
| Budget | Total cost budget of the projects ("budget at completion"). |
| Committed | Costs ordered but not yet booked (purchase orders, subcontracts), and share of the budget. |
| Actual Cost | Costs already booked (bills, timesheets, stock issues), and share of the budget. |
| Estimate at Completion | The expected final cost (EAC). In red when it is above the budget; the variance is budget minus EAC. |
| Forecast Margin | Contract value minus the estimate at completion, for projects that have both a client contract and a budget. |
| SPI | Schedule Performance Index = earned value / planned value. 1.00 or more: ahead of schedule; below 1.00: behind. |
| CPI | Cost Performance Index = earned value / actual cost. 1.00 or more: under budget; below 1.00: over budget. |
EARNED VALUE IN PLAIN WORDS
Planned value is the budget of the work that should be done by today. Earned value is the budget of the work actually done. Actual cost is what that work really cost. Comparing them tells you if you are late (SPI) and if you are spending too much (CPI). See Planning and Cost Control.
Charts
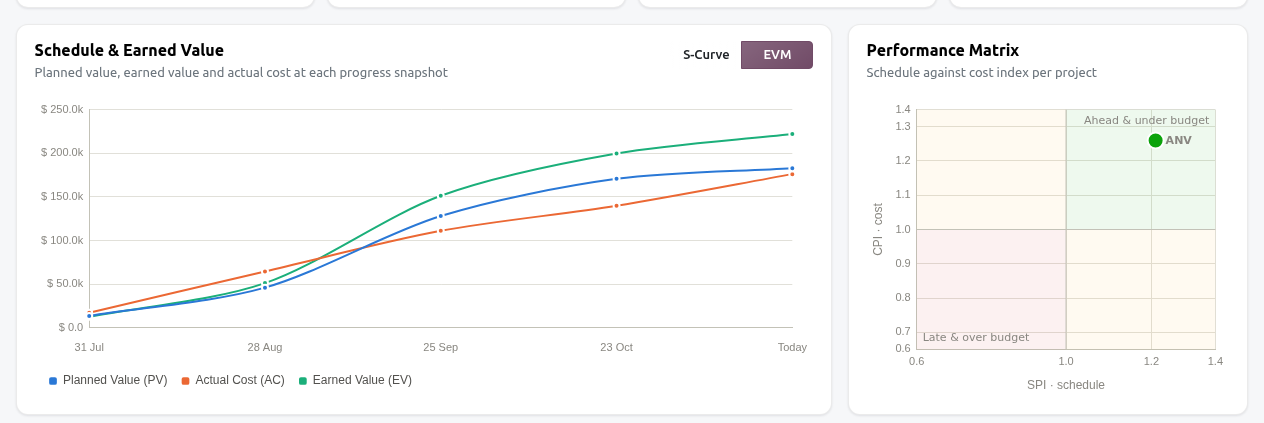
Schedule & Earned Value, Performance Matrix
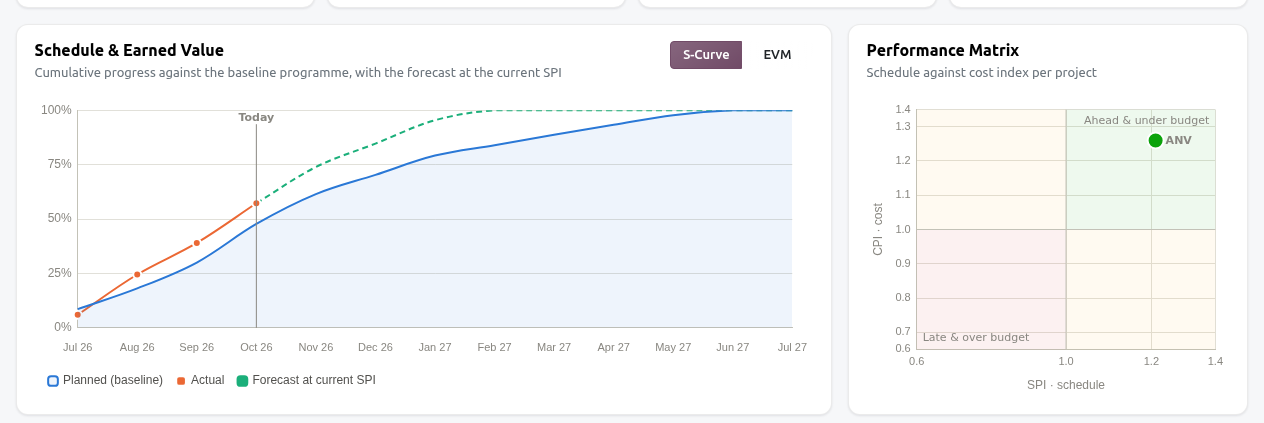
- S-Curve: cumulative planned progress from the baseline programme (blue area), the actual progress (orange) and the forecast of the remaining work at the current SPI (green dashes). The vertical line is today.
- Click EVM to see instead the planned value, earned value and actual cost at each progress snapshot.
- Performance Matrix: one dot per project, placed by its SPI (left to right) and CPI (bottom to top). Top right (green) is ahead and under budget; bottom left (red) is late and over budget.
Cash Flow, Contract Value
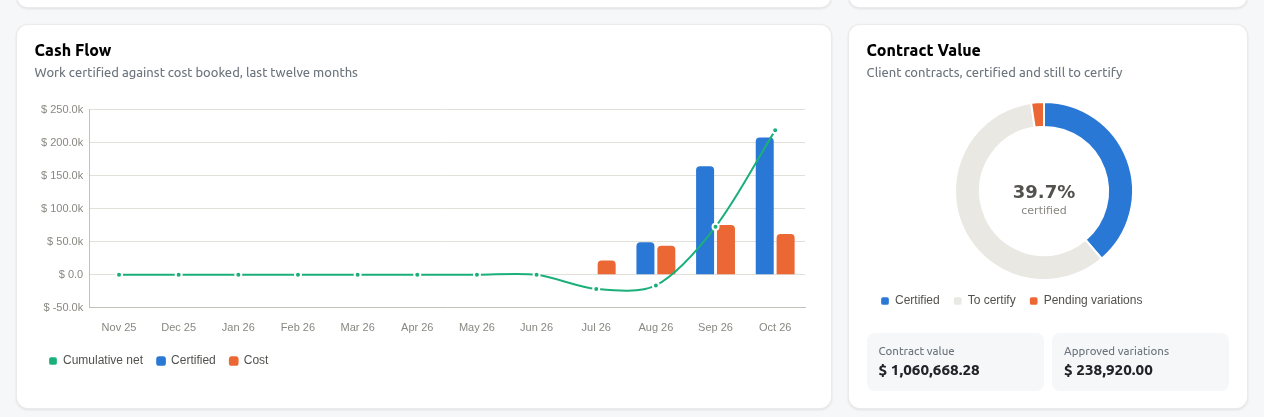
- Cash Flow: each month of the last twelve, work certified to clients (blue) against cost booked on the projects (orange). The green line is the cumulative difference: below zero, you have spent more than you have certified.
- Contract Value: the client contract value split into Certified and To certify, with the Pending variations on top.
Cost Control by Cost Type, Variations & Claims
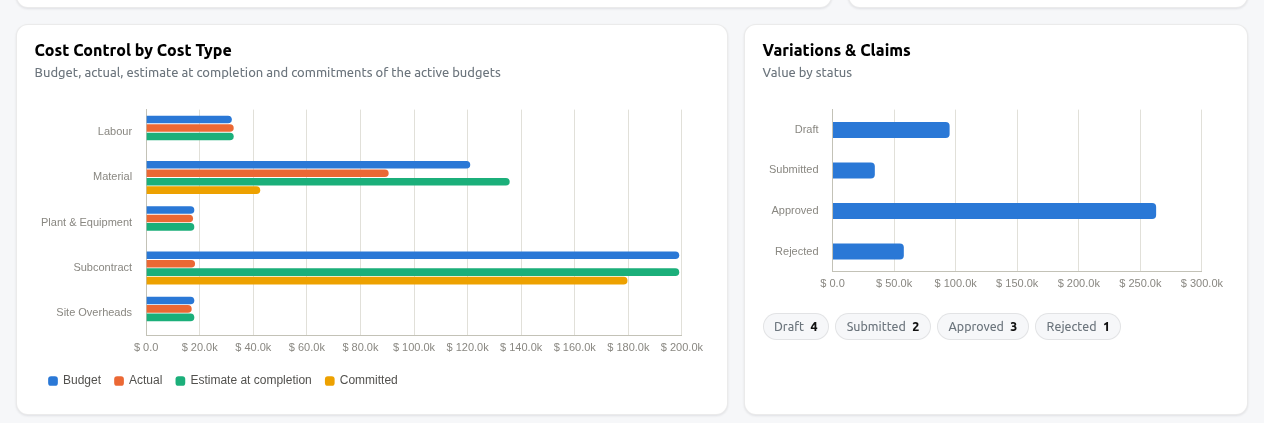
- Cost Control by Cost Type: for labour, material, plant, subcontract and site overheads, the budget, actual cost, estimate at completion and committed cost of the active budgets. A long orange or green bar compared with the blue one shows a cost type that is overrunning.
- Variations & Claims: the value of the variations in each state (Draft, Submitted, Approved, Rejected), with the number of variations under the chart. See Variations.
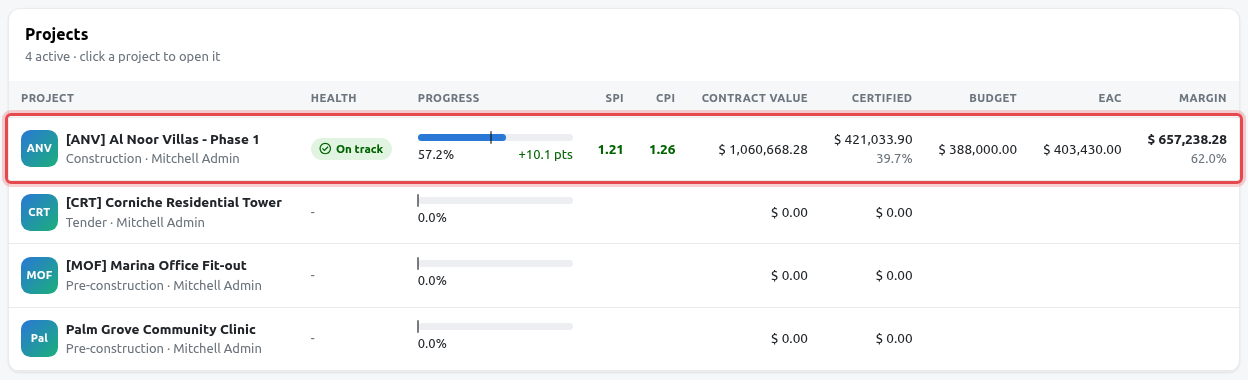
Projects
One line per project, with its phase, project manager, health, progress, SPI, CPI, contract value, certified amount, budget, estimate at completion (EAC) and margin.
The Health of a project is:
- Critical when the SPI or the CPI is below 0.90, or the forecast margin is negative;
- At risk when the SPI or the CPI is below 1.00, or the margin is below 5%;
- On track otherwise;
- a dash (-) when there is not enough data yet (no progress, no cost, no contract and budget).
The progress bar shows the actual progress; the small vertical mark is the planned progress; the green or red figure is the difference in points.
Open a project from the dashboard
In the Projects block, click the line of the project.
The project form opens. Use the breadcrumb Construction Dashboard at the top left to come back.
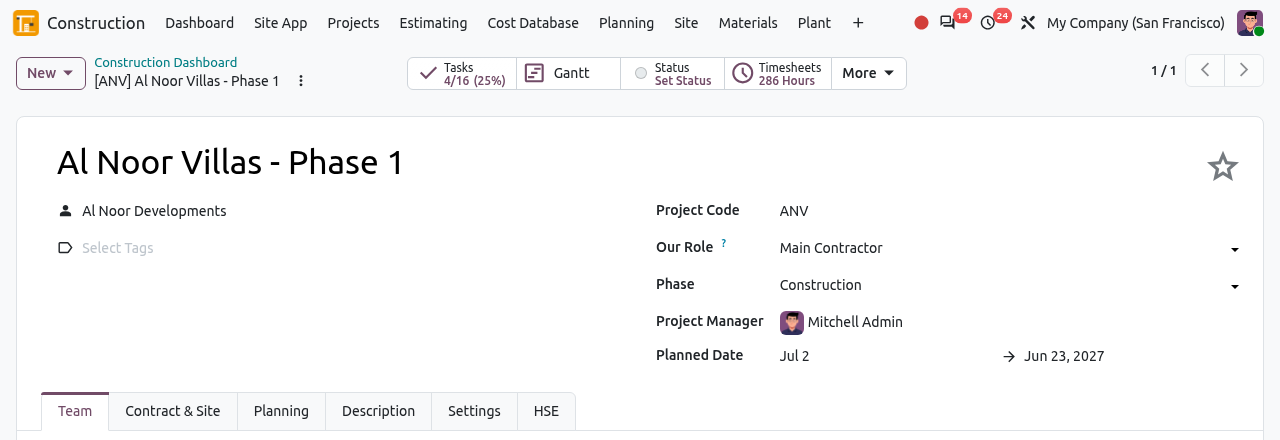
Al Noor Villas opened from the dashboard. The breadcrumb leads back to the dashboard.
Look at one project only
Choose the project in the All Projects list at the top. Every block of the dashboard then shows that project only. A new project such as [MOF] Marina Office Fit-out shows zeros and Not enough data until it has a contract, a budget and progress.
To Do, Upcoming & Late Activities, Risks & Alerts
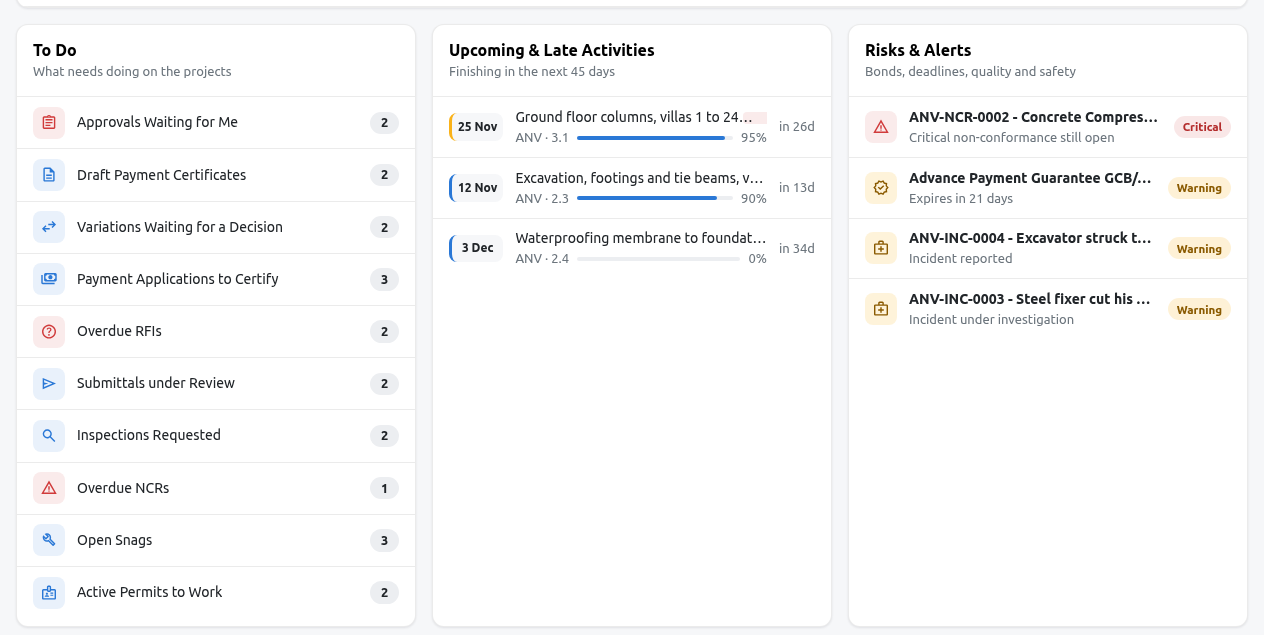
To Do
Counts of the records that wait for someone. Click a line to open the list of those records. Lines with nothing to do are hidden.
| Line | Records shown |
|---|---|
| Approvals Waiting for Me | Approval requests where you must decide now (Approvals) |
| Draft Payment Certificates | Certificates still in draft |
| Certificates Disputed by the Client | Certificates the client disputed (when this applies) |
| Variations Waiting for a Decision | Variations submitted to the client or received from a subcontractor |
| Payment Applications to Certify | Payment applications received and not yet certified |
| Overdue RFIs | Requests for information past their due date |
| Submittals under Review | Submittals waiting for the consultant's answer |
| Inspections Requested | Quality inspections requested and not done yet |
| Overdue NCRs | Non-conformance reports past their due date |
| Open Snags | Defects still open |
| Active Permits to Work | Permits to work currently valid |
| Overdue Instalments | Unpaid instalments of units sold (Property Sales only) |
Click Approvals Waiting for Me. The list of these approval requests opens; click one to decide.
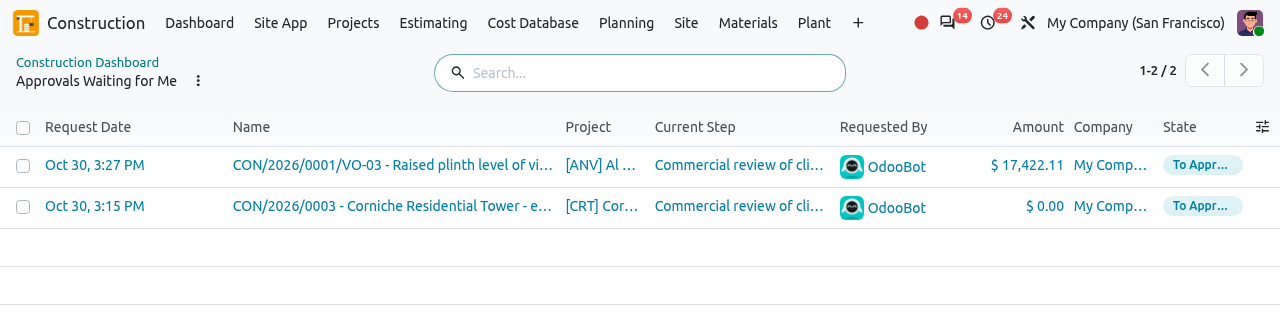
The approval requests waiting for me, opened from the To Do block.
Upcoming & Late Activities
The schedule activities that finish in the next 45 days or are already late, late and critical ones first. Each line shows the due date, the project code and activity number, the progress and "in x days" (or "x d late" in red). Click a line to open the activity.
Risks & Alerts
Commercial and compliance risks (up to ten, critical ones first). Click a line to open the record.
- Bonds and guarantees that expire within 60 days or have expired (Critical under 15 days).
- Client contracts that must be completed within 90 days while the project is below 80% progress.
- Major or critical non-conformance reports (NCRs) still open.
- Safety incidents reported or under investigation.
Quality and Health & Safety
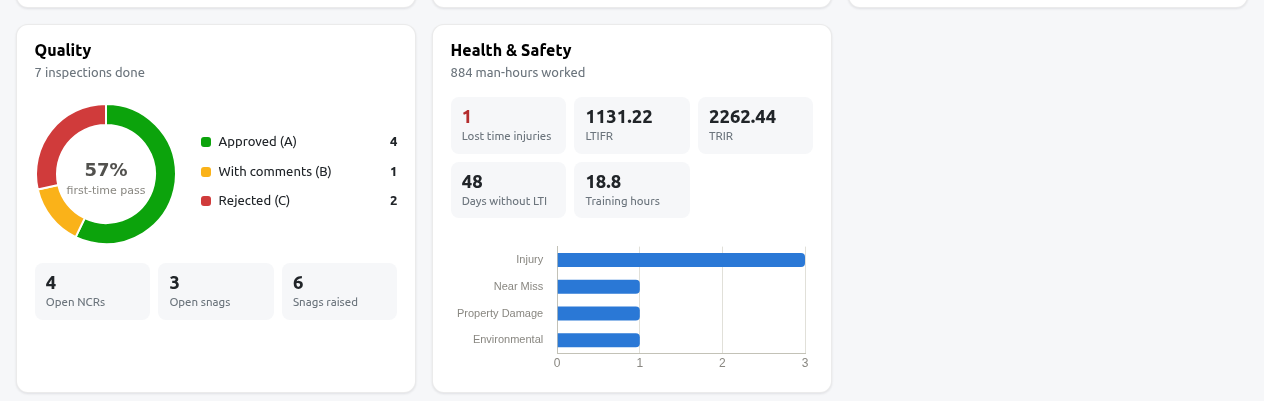
- Quality: number of inspections done and their results, A (approved), B (approved with comments), C (rejected). The first-time pass rate is the share of A results. Below: open NCRs, open snags and snags raised. See Quality.
- Health & Safety: man-hours worked, lost time injuries, LTIFR and TRIR (per million man-hours), the smallest number of days without a lost time injury among the projects, toolbox training hours, and the incidents by type. See HSE.
- Property Sales (only when the property apps are installed): units, sales value, amount collected and overdue.
The line at the bottom of the page reminds you of the currency and of the health rules.
Company and group view
If you work for several companies of a group (for example a main contractor and its MEP subsidiary), you can see them together.
In the company switcher at the top right of Odoo, tick all the companies you want to see.
On the dashboard, click Group. The overview now says All companies of the group. Click Current Company to come back to the company you are working in.
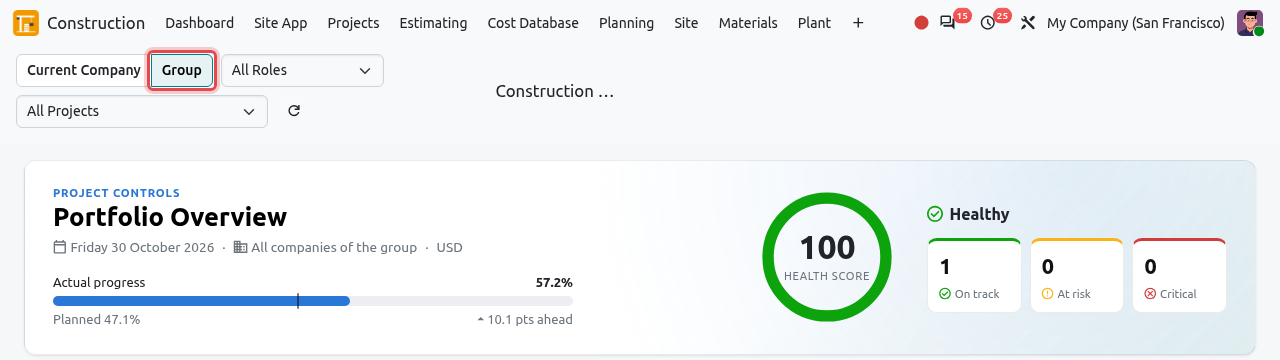
The Group view. The Projects block now lists the projects of every selected company, with the company name on each line.
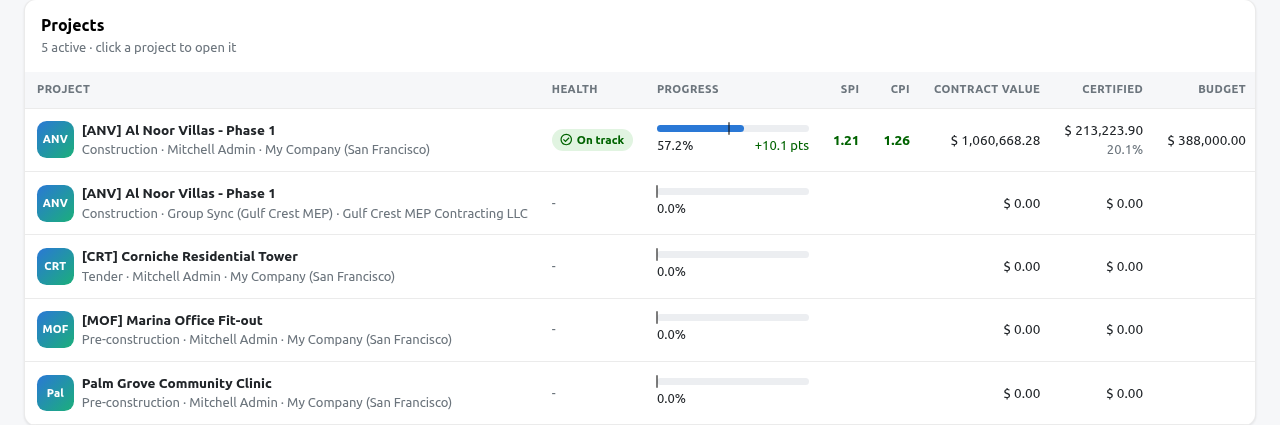
The Al Noor Villas project appears twice: once for the main contractor and once for the MEP subsidiary, which works on the same site.
GOOD TO KNOW
In the group view, amounts of the other companies are converted into the currency of the current company. Contracts between two companies of the group are left out, so that the same work is not counted twice. See Inter-company.
Tips
TIP
- The figures are as good as the data behind them: progress comes from the schedule (Planning), cost from the budget (Cost Control), value from the contracts and certificates. A project without a budget shows no EAC and no margin.
- Click ↻ after approving or changing records in another tab to refresh the figures.