
Appearance
Planning
The Planning menu holds the time plan of your projects: the list of activities (the schedule), their dates and links, a Gantt chart, frozen copies of the plan (baselines) and the weekly progress curve (S-curve). It tells you whether a project is ahead of or behind its plan.
WORDS USED IN THIS CHAPTER
- WBS (work breakdown structure): the list of the project's activities, grouped in levels. For example 2 Substructure contains 2.1 Excavation and 2.2 Footings. In Odoo each WBS line is a task of the project.
- BOQ (bill of quantities): the priced list of work items of the contract. The WBS can be built from it automatically.
- Dependency: a task that must finish before another one can start. In Odoo the column is called Blocked By.
- Critical path: the chain of tasks that has no spare time. If one of them is late, the whole project finishes late. Critical tasks are shown in red.
- Float: the number of working days a task can slip without delaying the end of the project.
- Baseline: a frozen copy of the planned dates, for example the programme approved at contract award. Later you compare the current plan with it.
- Milestone: a task with a duration of 0 days, for example Enabling works complete. It is shown as a diamond.
Where: . Who: planners (role Planner or Planning Manager) build and update the schedule; project managers and site engineers read it and update the progress of the tasks. Only planners see the buttons that change the schedule (Generate WBS from BOQ, Schedule, Set Baseline).
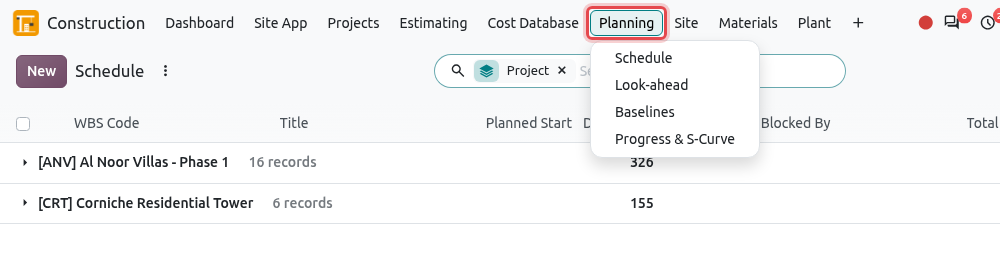
The normal planning cycle of a project is:
Generate WBS from BOQ→Durations & dependencies→Schedule→Set Baseline→Update progress→Progress Snapshot
The Planning tab of the project
Most planning actions start from the project itself. Open , click the project, then click the Planning tab. The tab has four buttons and shows the progress and the earned value of the project (explained in Progress & S-Curve).
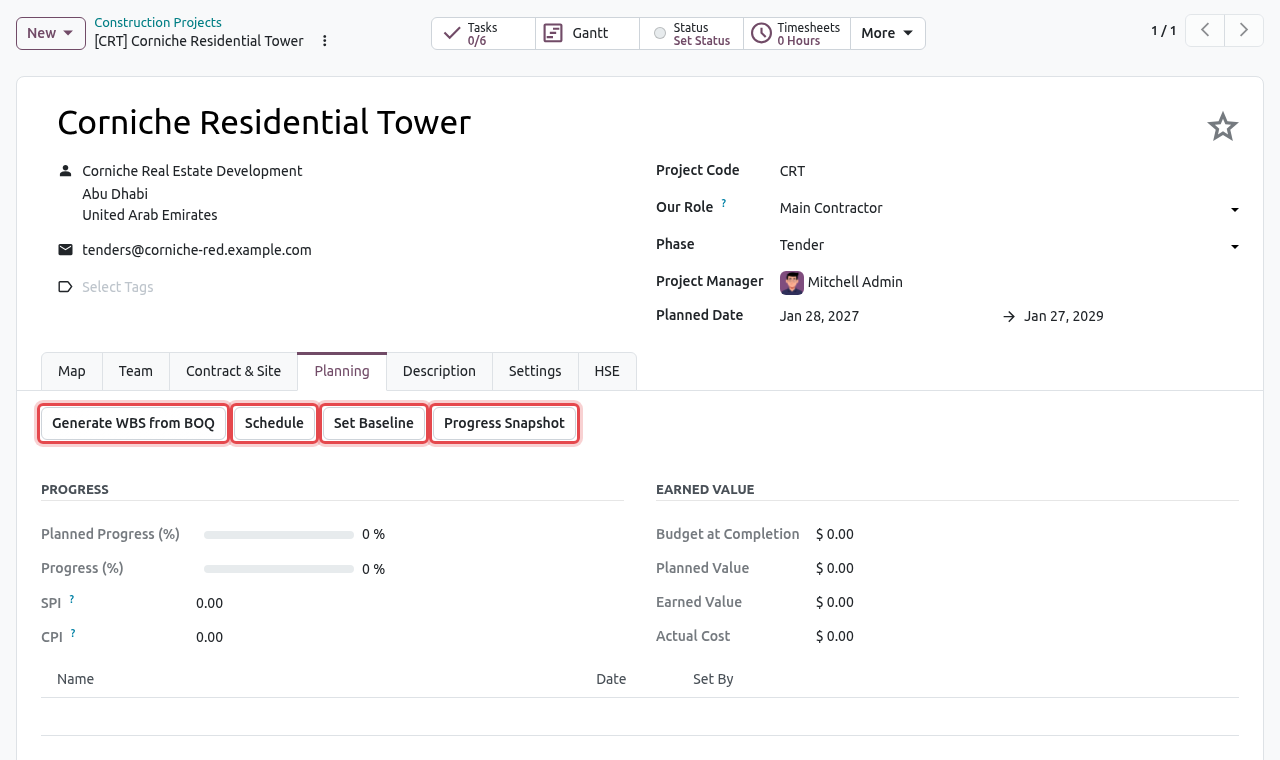
| Button | What it does |
|---|---|
| Generate WBS from BOQ | Creates one task per section and item of the client contract BOQ (or of the won estimate when there is no contract yet). Running it again updates the existing tasks instead of creating duplicates. |
| Schedule | Calculates the dates of all tasks from the project start date, the durations and the dependencies. It also finds the critical path and the float. |
| Set Baseline | Freezes the current dates as a new baseline (Baseline 1, Baseline 2...). |
| Progress Snapshot | Records today's planned and actual progress and the earned value figures. These records draw the S-curve. Odoo also takes a snapshot automatically every week. |
The Gantt smart button at the top of the project form opens the Gantt chart of the project (see The Gantt chart).
Walkthrough: build the schedule of a project
This example plans the enabling works of [CRT] Corniche Residential Tower, from the BOQ to the first baseline.
Step 1: generate the WBS from the BOQ
Open the project and click the Planning tab.
Click Generate WBS from BOQ. Odoo asks for a confirmation. Click Ok.
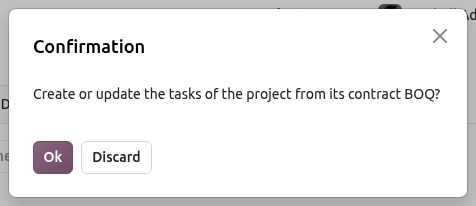
The confirmation message. Odoo creates the tasks. Each BOQ section becomes a summary task (in bold) and each BOQ item becomes an activity under it, with:
- the BOQ code as WBS Code and the item description as title;
- a Weight (%) equal to the item's share of the contract value (an item worth 10% of the contract counts for 10% of the progress);
- the BOQ quantity and unit as Planned Quantity;
- a default Duration (days) of 5 working days, that you adjust in the next step.
WARNING
The button needs a client contract (draft or running) or a won estimate on the project. Otherwise Odoo shows "... has no contract nor won estimate to build the WBS from." Running it again later overwrites the names, WBS codes, parents and weights of the tasks linked to the BOQ with the BOQ values. If you reorganised the tasks by hand, do not run it again.
You can also add tasks by hand (for example tests, approvals or milestones that are not in the BOQ): in the schedule list, click Add a line under the project, or create a task in the project as usual.
Step 2: enter durations and dependencies
Go to . The tasks are grouped by project. Click the project name to open its group.
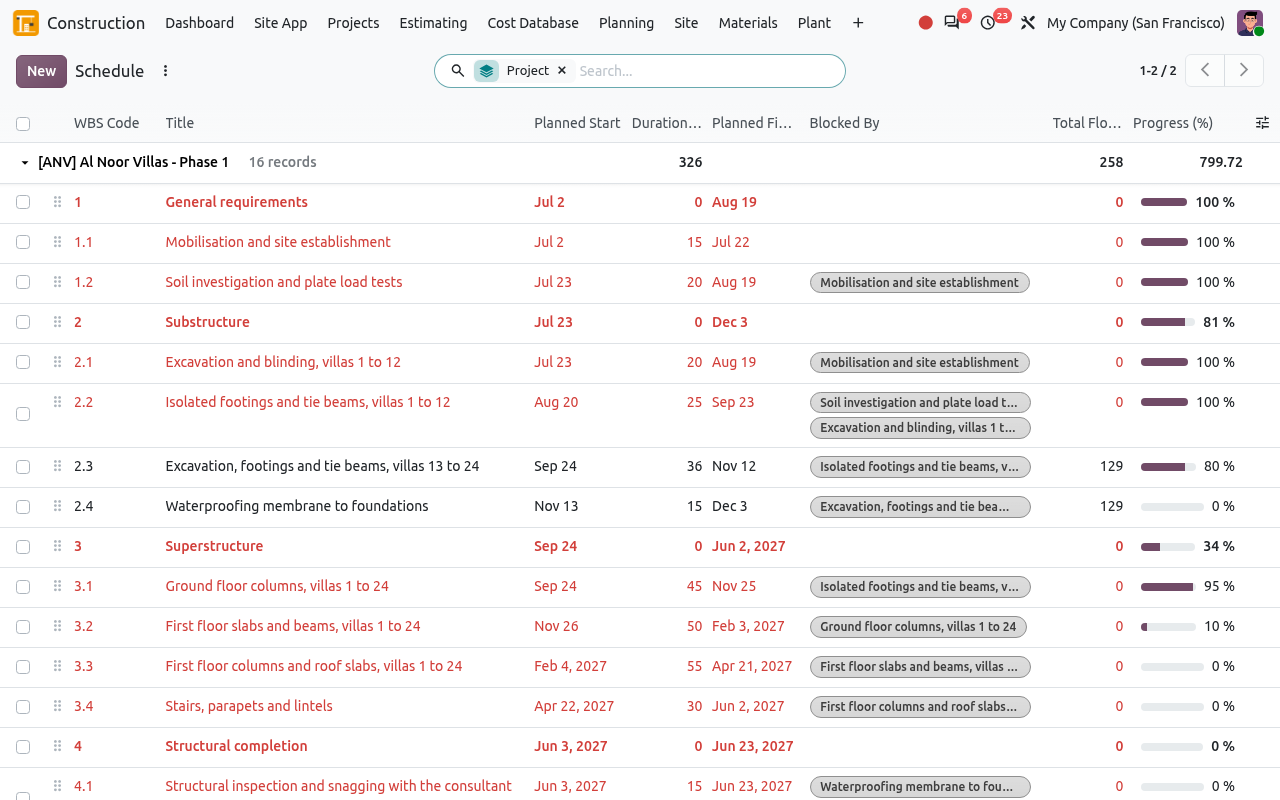
The schedule of [ANV] Al Noor Villas - Phase 1. Bold lines are summary tasks; red lines are on the critical path. Click a line to edit it directly in the list. Type the Duration... in working days, and in Blocked By pick the task(s) that must finish first. Click Save at the top.
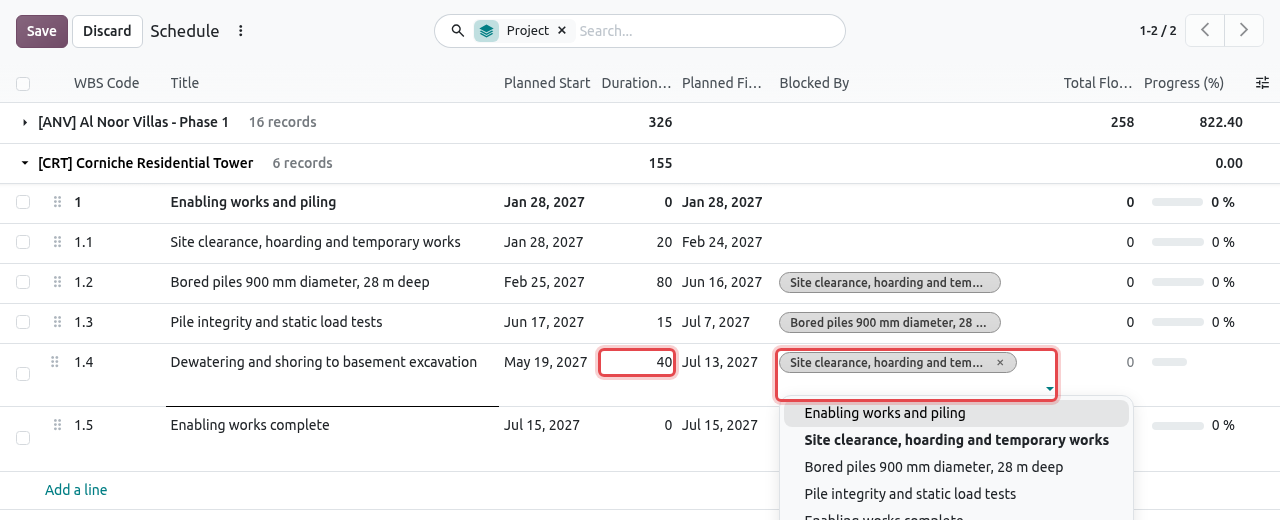
Editing 1.4 Dewatering and shoring: it lasts 40 days and is blocked by Site clearance, hoarding and temporary works.
| Column | What to enter |
|---|---|
| WBS Code | The number of the activity, for example 1.4. Filled automatically from the BOQ. |
| Title | The name of the activity. |
| Planned Start | Only needed for tasks without dependency. Otherwise Schedule calculates it. |
| Duration (days) | Working days of the company calendar (weekends and public holidays are skipped). 0 makes the task a milestone. |
| Planned Finish | Calculated from the start and the duration. If you change it, Odoo adapts the duration. |
| Blocked By | The tasks that must finish before this one starts (finish-to-start). |
| Total Float | Calculated: the spare days of the task. 0 means critical. |
| Progress (%) | How much of the task is done. Drag the bar or click it and type a number. |
The dates, duration and dependencies of a summary task cannot be edited: they follow its sub-tasks. Its progress is the weighted average of its sub-tasks.
TIP
More columns are hidden: click the settings icon at the right end of the column titles to show Weight (%), Baseline Finish, Delay (days), Parent or Assignees. Use the handle at the left of a line to change the order of the tasks.
The Planning tab of a task
Click the title of a task (or open it from the project) to see its full form. The Planning tab shows all its planning data in one place. Site engineers mostly use it to update the Progress (%).
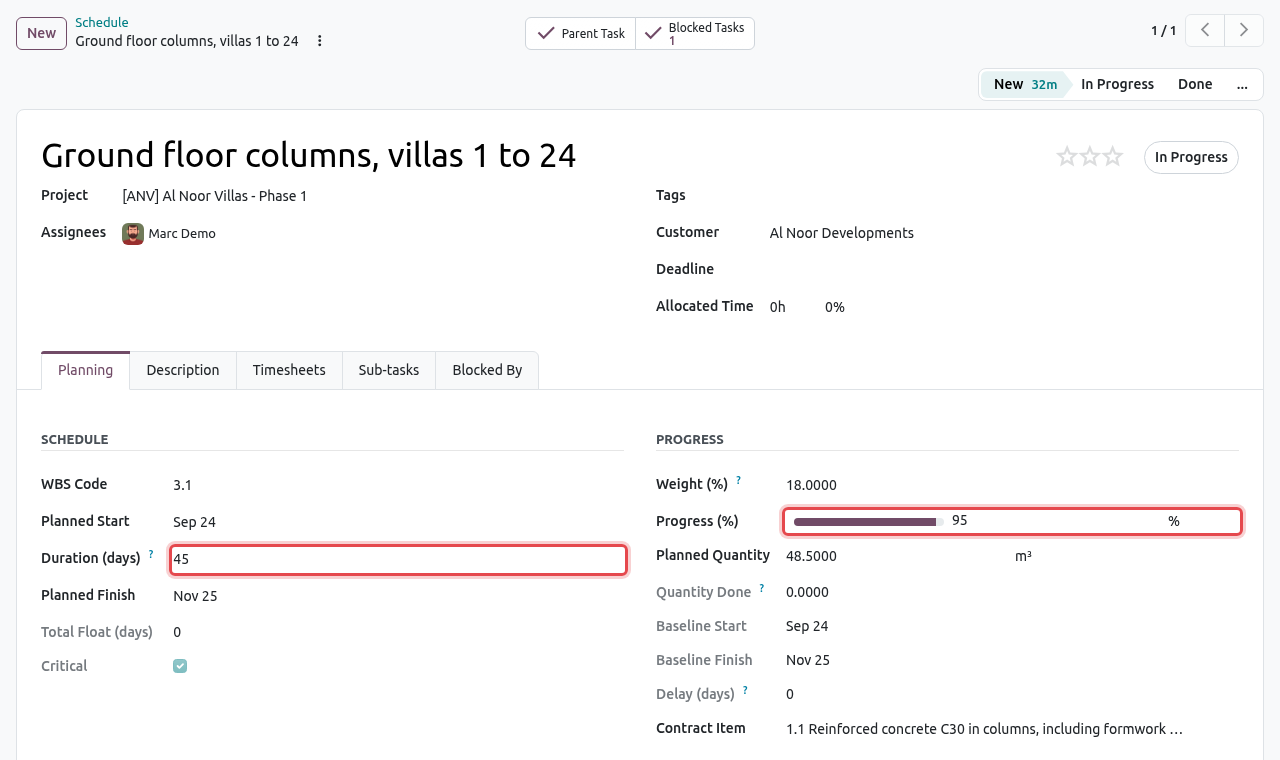
| Field | Meaning |
|---|---|
| Weight (%) | Share of this task in the progress of the project. By default its share of the contract value. You can change it on activities. |
| Planned Quantity | The quantity of the BOQ item, with its unit. |
| Baseline Start / Finish | The dates frozen by the last baseline (read-only). |
| Delay (days) | Calendar days between the baseline finish and the current planned finish. A positive number means the task now ends later than agreed. |
| Critical, Total Float (days) | Results of the last Schedule. |
Step 3: schedule the project
Open the project and click the Gantt smart button (or click Schedule in the Planning tab of the project). Before scheduling, the dates may be inconsistent: in this example the summary task 1 Enabling works and piling is a single day and the dewatering starts in May although it could start in February.
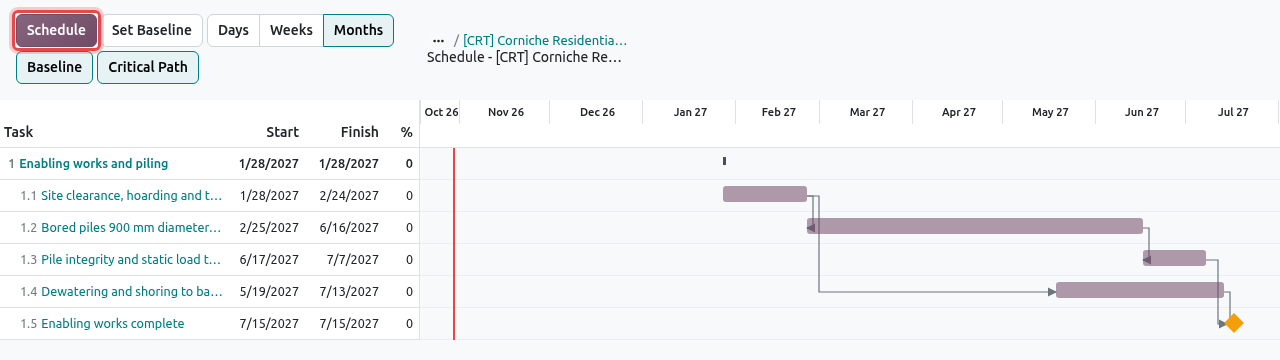
The Gantt chart before scheduling. The Schedule button is framed. Click Schedule. Odoo shows "The project was scheduled from its dependencies." and redraws the chart:
- each task starts on the first working day after its last predecessor finishes; tasks without predecessor start on the project start date;
- tasks on the critical path turn red; the others keep their float (here the dewatering can slip until the piling tests are finished);
- summary tasks stretch over their sub-tasks.
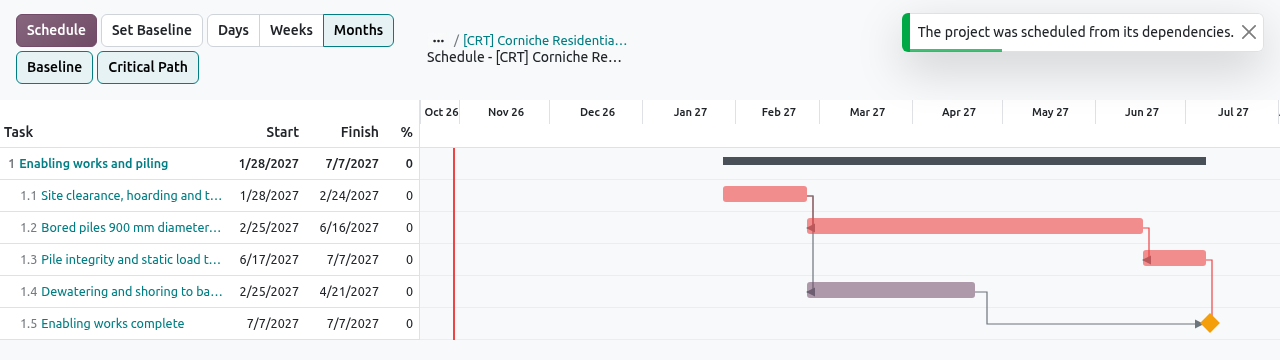
After scheduling: the critical path (red bars) goes through site clearance, piling and pile tests to the milestone.
WARNING
Schedule also changes the end date of the project (the second date of Planned Date on the project form) to the finish of the last task. If your schedule only covers the first works, check the project end date afterwards and correct it if needed. If the dependencies make a loop (A waits for B and B waits for A), Odoo refuses with "The dependencies of these tasks loop: ...".
Step 4: set a baseline
When the programme is agreed (for example approved by the consultant), freeze it as a baseline.
In the Gantt chart, click Set Baseline (or the same button in the Planning tab of the project). Confirm with Ok.
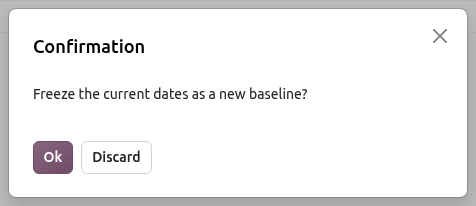
The confirmation message. Odoo creates Baseline 1 and copies the current dates of every task into its Baseline Start and Baseline Finish. In the Gantt chart the baseline appears as a thin grey bar under each task bar (button Baseline switched on).
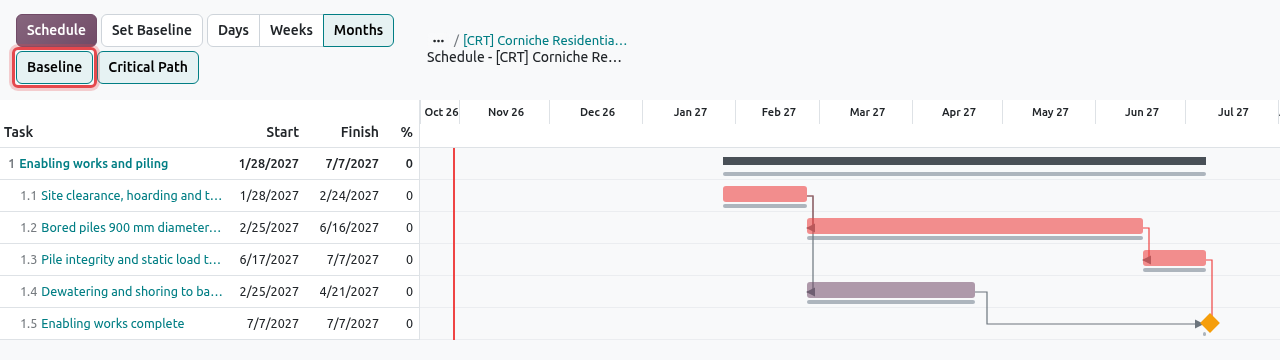
The Baseline and Critical Path display buttons are framed. The grey bars are the baseline.
The next steps (update the progress, take snapshots) are explained in Update the progress and Progress & S-Curve.
The Gantt chart
Open it with the Gantt smart button of the project form. You can also select projects in the project list and choose Open Gantt in the Actions (gear) menu.
- Left part: WBS code, task, start, finish and progress %. Click the arrow next to a summary task to fold or unfold it. Click a task name to open the task in a pop-up.
- Right part: one bar per task. The dark filling inside a bar is the progress. Arrows are the dependencies. The red vertical line is today. Summary tasks are dark thin bars; milestones are orange diamonds.
- Days / Weeks / Months: change the time scale. Use Months to see a long project on one screen.
- Baseline: show or hide the baseline bars. Critical Path: show or hide the red colour of critical tasks.
- Drag a bar to move a task to other dates; drag its right end to change its duration. Then click Schedule again so that the following tasks move too.
TIP
Only planners can move bars and use Schedule and Set Baseline in the chart. Other users see the chart read-only.
Schedule (all projects)
lists the tasks of all construction projects, grouped by project (see the screenshot in Step 2). Open the search options (the small arrow at the right of the search bar) to use the ready-made filters:
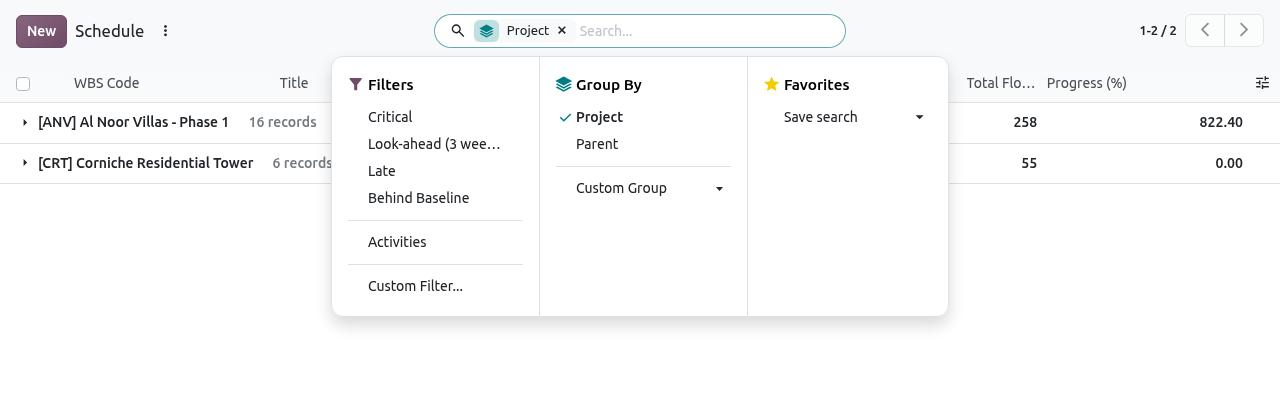
| Filter | Shows |
|---|---|
| Critical | Tasks on the critical path. |
| Look-ahead (3 weeks) | Unfinished tasks planned between today and three weeks from now. |
| Late | Tasks whose planned finish is past and that are not 100% done. |
| Behind Baseline | Tasks that now finish later than in the baseline (delay above 0). |
| Activities | Hides the summary tasks, keeps the real activities. |
You can also group by Parent (summary task) and type a WBS code or a task name in the search bar.
Look-ahead
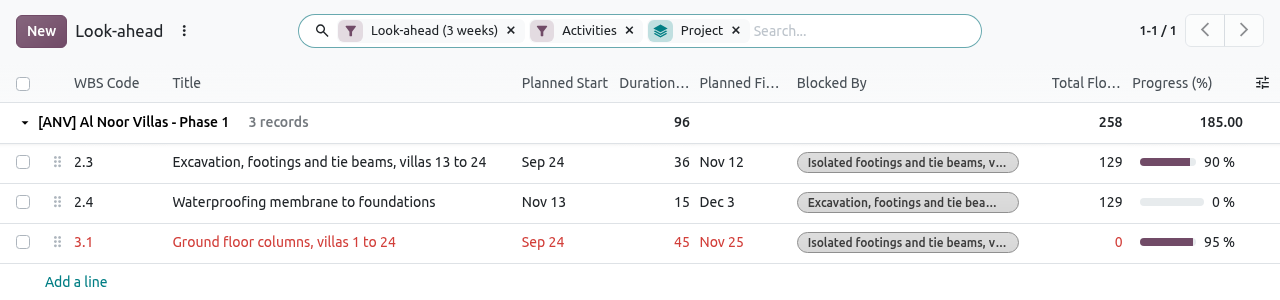
is the same list with the Look-ahead (3 weeks) and Activities filters already on. Use it in the weekly site meeting: it shows what the site must work on in the next three weeks, and what is still open from before.
Update the progress
Open (or Schedule) and open the group of your project.
On each activity, click the Progress (%) bar and type the percentage done (for example 95). Click Save. You can do the same in the Planning tab of the task form (see The Planning tab of a task).
The progress of the summary tasks and of the project is recalculated at once, weighted by the Weight (%) of each activity.
NOTE
Progress is a number between 0 and 100. Odoo refuses other values ("Progress is between 0 and 100%."). Summary tasks cannot be edited: update their sub-tasks.
Baselines
lists the baselines of all projects. Baselines are created only with the Set Baseline button (there is no New button here). A project can have several: the tender programme, the approved contract programme, a programme revised after an extension of time...
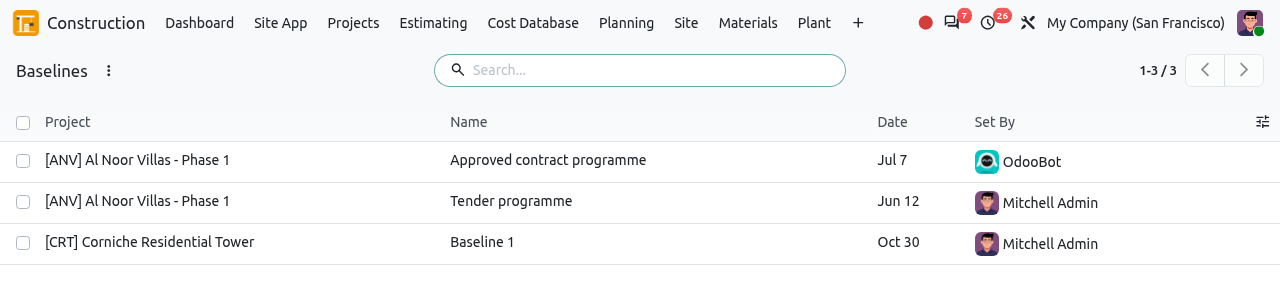
Click a baseline to open it. You can rename it, change its Date and write a note explaining why it was set. The task lines (start, finish and weight of every task at that moment) are read-only.
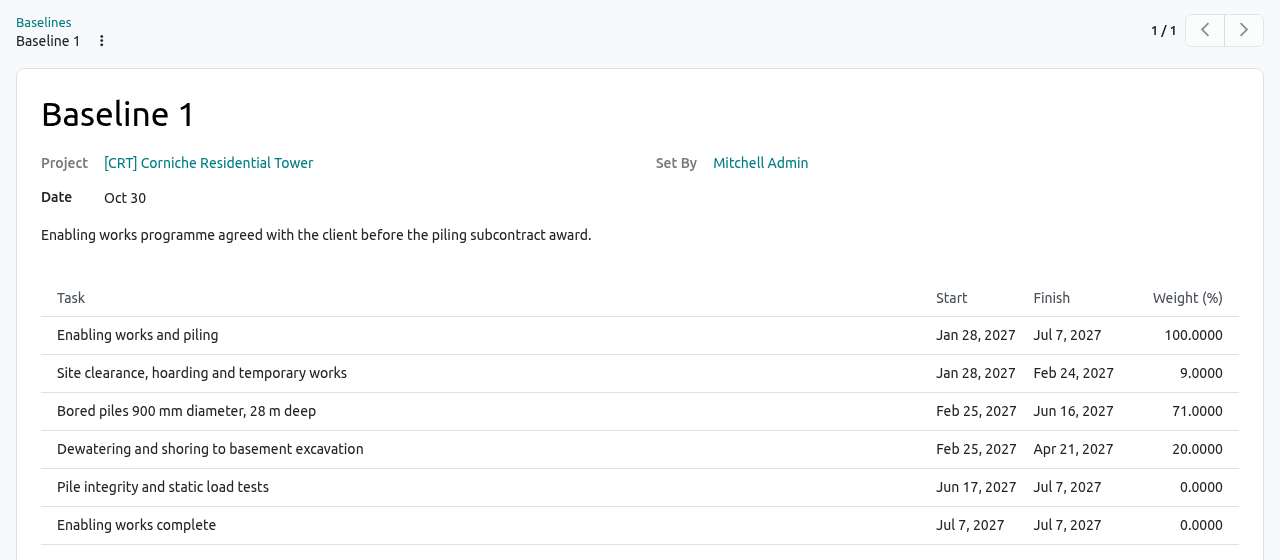
Baseline 1 of the Corniche tower, with a note.
TIP
The baseline dates of the tasks always come from the last baseline you set. The planned progress (and so the SPI) is measured against these dates. Set a new baseline only for an agreed change, such as an approved extension of time, otherwise delays disappear from the reports.
Progress & S-Curve
Every week Odoo takes a progress snapshot of each project in the pre-construction, construction or handover phase. A snapshot records, at a date, how much of the project should be done and how much is done. Put on a chart, these points draw the S-curve of the project.
Take a snapshot by hand
Open the project, click the Planning tab and click Progress Snapshot. Odoo records today's figures; nothing else changes on the screen.
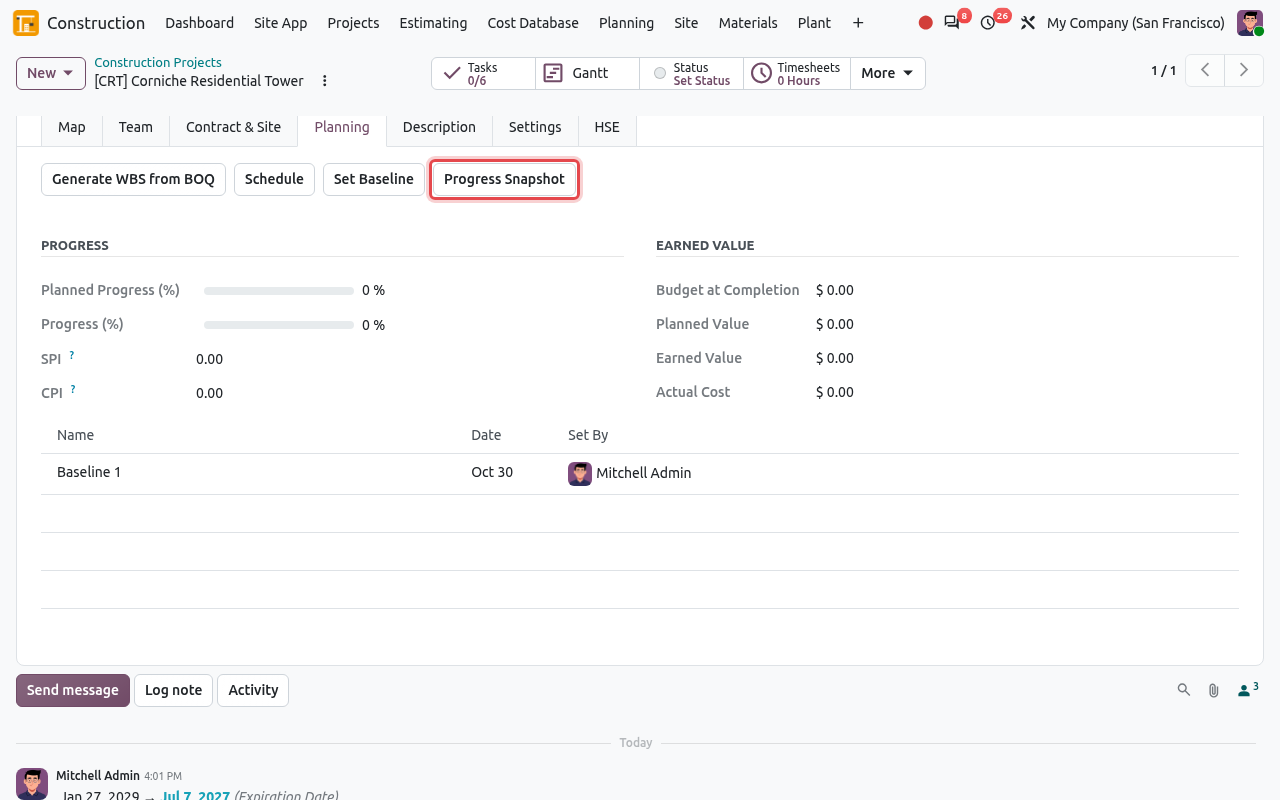
The Progress Snapshot button. The list below shows the baselines of the project. Go to and click the list icon at the top right. The new snapshot is in the list.
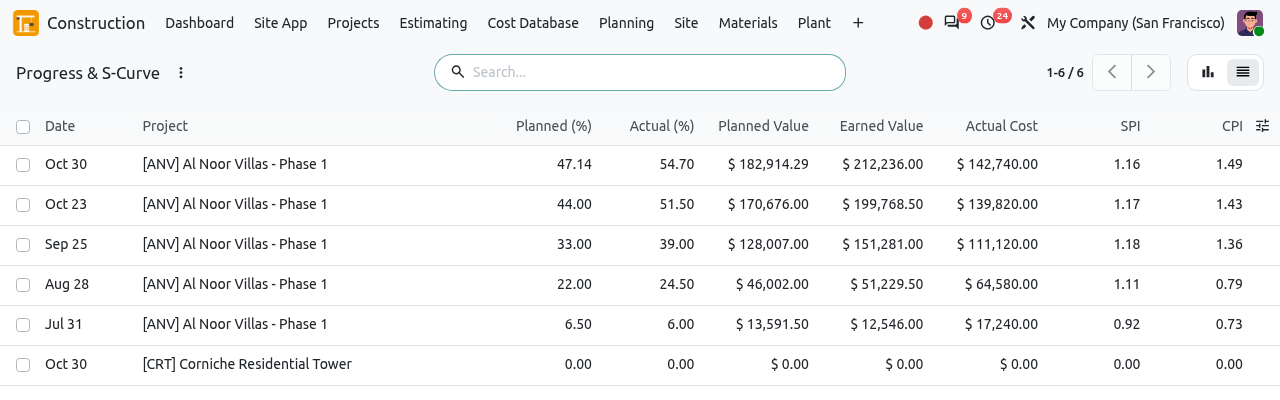
The snapshots. The last line is the one just taken on the Corniche tower: everything is 0 because its works have not started yet.
Read the figures (SPI and CPI in plain words)
The Planning tab of the project shows the figures of today; each snapshot keeps the figures of its date.
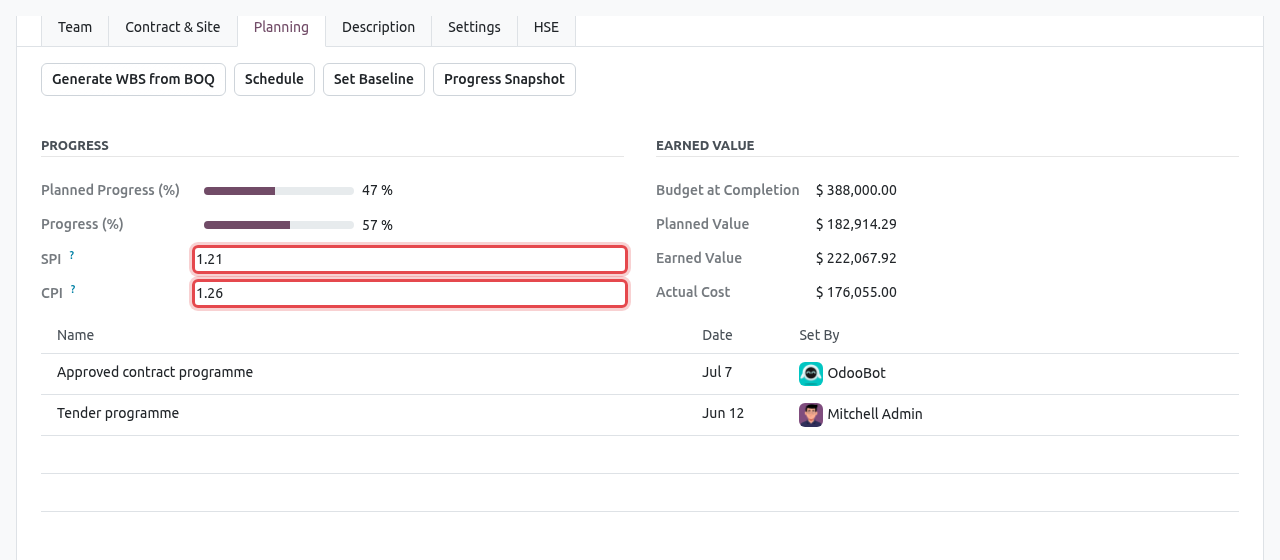
| Figure | Meaning |
|---|---|
| Planned Progress (%) | How much should be done today according to the baseline dates (or the planned dates when there is no baseline), weighted by the task weights. |
| Progress (%) (Actual) | How much is really done: the weighted progress of the activities. |
| Budget at Completion | The total of the project's active budget. |
| Planned Value | The value of the work that should be done: Budget × Planned Progress. |
| Earned Value | The value of the work really done: Budget × Progress. |
| Actual Cost | What the project has really cost so far (from the budget). |
| SPI (schedule performance index) | Earned Value ÷ Planned Value. Above 1: ahead of programme. Below 1: behind. 1.21 means 21% more work done than planned. |
| CPI (cost performance index) | Earned Value ÷ Actual Cost. Above 1: the work costs less than budgeted. Below 1: over cost. 1.26 means each dollar spent produced 1.26 dollars of budgeted work. |
NOTE
The money figures, and so the CPI, need an active budget on the project (see Cost Control). Without one they stay at 0. SPI and CPI show 0.00 when they cannot be calculated (nothing planned yet, or no cost yet).
The S-curve chart
opens as a line chart.
Type the project name in the search bar and choose Search Project for: ..., so that the chart shows one project only.
The chart shows one measure at a time. Click the purple measure button (Actual (%)) to switch to Planned (%), SPI or CPI.
To get a smooth curve with monthly points, open the search options and under Group By choose Custom Group > Date (grouped by month).
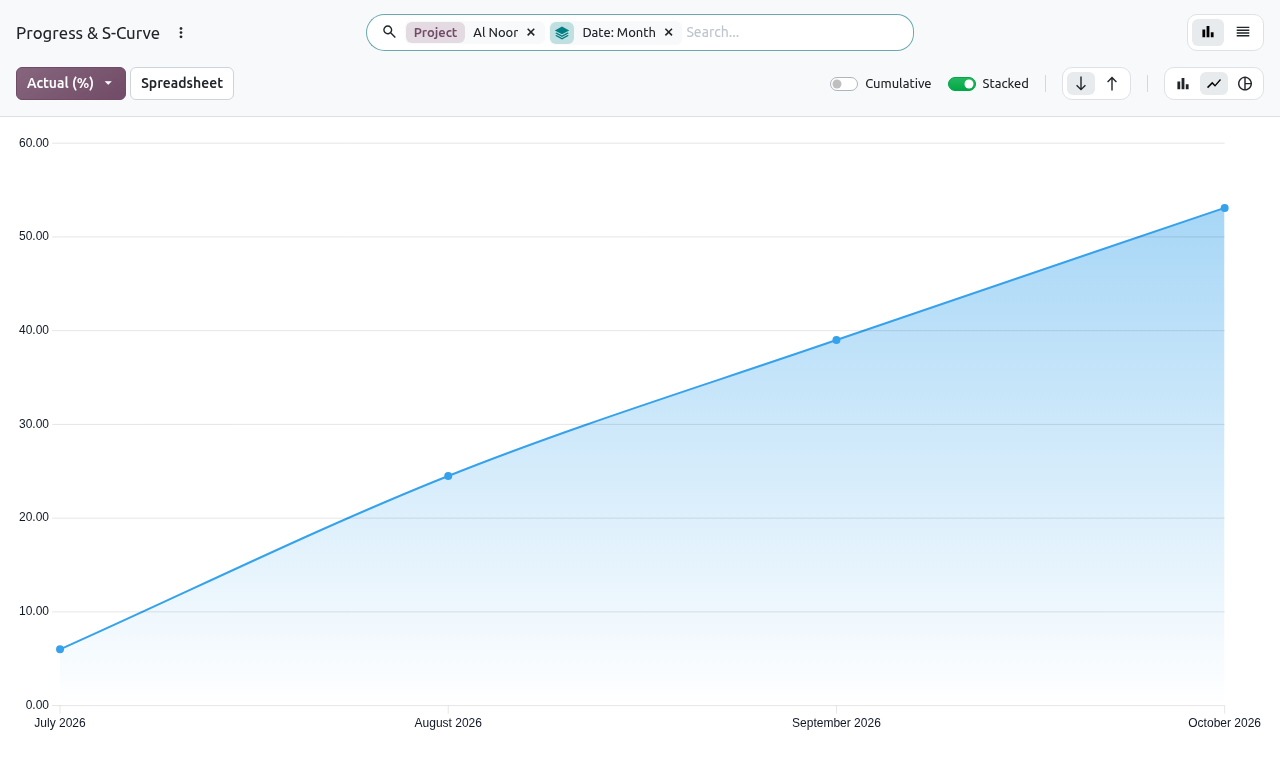
Actual progress of Al Noor Villas, month by month.
Use the filters Behind Schedule (SPI below 1) and Over Cost (CPI below 1) to find the snapshots, and so the projects, that need attention.
READING THE CHART
The chart shows the average of the snapshots in each period. By default it groups by week: weeks without a snapshot appear as 0, which makes the curve go up and down. Group by month as above, keep the Cumulative switch off, and filter on one project. For exact figures, use the list view.
Tips and common mistakes
- Dates do not move after I change a duration. Changing a duration only changes the finish of that task. Click Schedule so that the following tasks move.
- A task is not red although it is late. Red means critical (no float), not late. Use the Late and Behind Baseline filters to find late tasks.
- "Schedule ... before setting a baseline." A baseline needs dates. Click Schedule first.
- "... has no task to schedule." Generate the WBS or add tasks first.
- Weights do not add up to 100%. Tasks added by hand get a weight of 0, so they do not count in the progress. Give them a weight in the task form if they should.
- Group totals in the schedule list. The numbers in the project group line (for example the sum of the progress) add up the percentages and floats of all tasks; they are not the project progress. Read the project progress in the Planning tab of the project.